Every year, Japan’s Ministry of Land, Infrastructure, Transport and Tourism (MLIT) releases its official land price survey, known as the koji chika (公示地価). This report measures the value of land at thousands of locations across the country as of January 1 each year. It is the closest thing Japan has to an official report card on where property values are heading.
The 2026 report showed that land prices across all categories rose by 2.8% nationwide. That is the strongest increase since 1992. In simple terms, land in Japan is rising faster than it has in over 30 years.
But a national average only tells part of the story. This article breaks down what the 2026 land price data actually shows, where prices are rising fastest, where they are falling, and what it all means if you are buying, selling, or thinking about property in Japan.
What Is the Official Land Price Survey?
The MLIT’s Land Appraisal Committee selects around 26,000 locations across Japan and assigns a value to each one based on professional appraisals. These values reflect what the government believes the land is worth per square meter as of January 1 each year.
This survey has been running since 1970 and serves as a reference point for land transactions, tax assessments, and public land acquisitions. It covers residential, commercial, and industrial land across every prefecture in the country.
It is important to understand that these are benchmark values, not actual sale prices. They show the direction of the market, but what buyers actually pay for a specific property can be quite different depending on size, condition, location within a neighborhood, and how motivated the seller is.
Source: MLIT Official Land Price Survey (令和8年地価公示), published March 17, 2026. Available at https://www.mlit.go.jp/totikensangyo/index.html – Japanese only
How Much Did Land Prices Rise Across Japan in 2026?

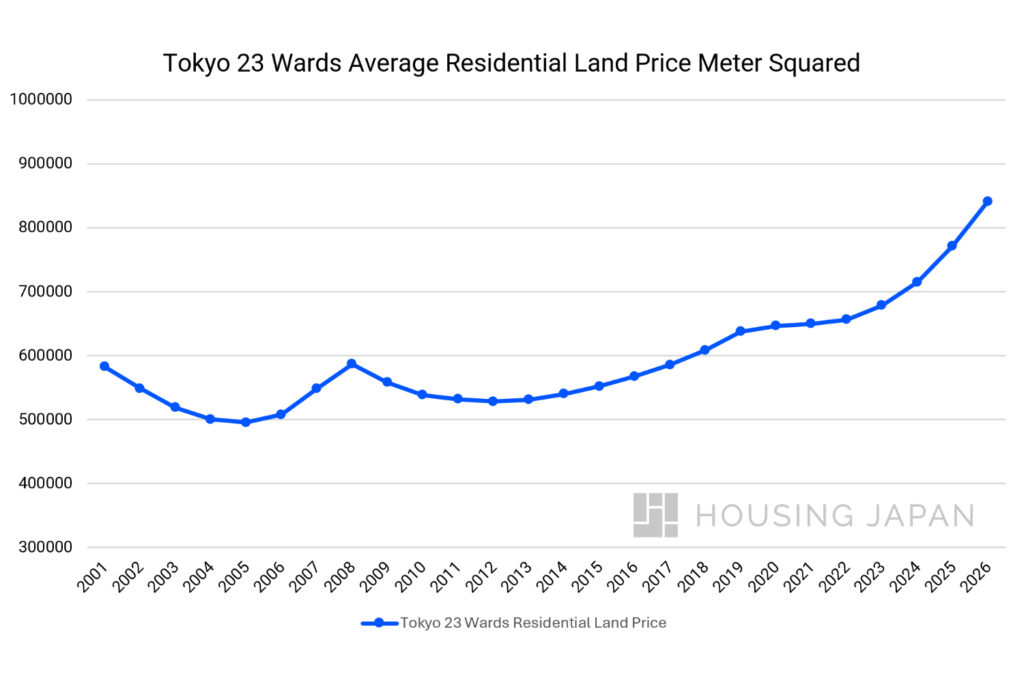
Across the 25,565 benchmark points surveyed, the national average rose to ¥297,840 per square meter, up from ¥289,730 the year before. Of those survey points, 17,016 showed price increases, 4,872 showed declines, and 3,677 were flat.
Breaking that down by land type, commercial land rose by 4.3% (up from 3.9% in 2025), while residential land increased by 2.1%, the same pace as the previous year. This means commercial property remains the faster-moving part of the market, driven by office demand, tourism, and redevelopment activity.
The Greater Tokyo Area saw overall land prices climb 5.7%, with residential up 4.5% and commercial up 9.3%. The Osaka metropolitan area followed at 3.8% overall. The Nagoya area grew more slowly at 2.3%, with growth actually slowing compared to the year before.
Outside the three major metro areas, regional land prices still rose for a fifth straight year, averaging 1.2% across all land types. This is a meaningful shift from the years when rural Japan saw nothing but declining values.
Where Did Land Prices Rise Fastest in 2026?
The biggest jumps in the 2026 survey came from three very different types of locations: semiconductor and logistics hubs, ski resort areas, and urban redevelopment zones in Tokyo and Osaka.
| Rank | Location | Year-on-Year Change | What Is Driving It |
|---|---|---|---|
| 1 | Chitose, Hokkaido | +44.1% | Semiconductor factory and airport access |
| 2 | Chitose, Hokkaido | +38.5% | Hotel and tourism infrastructure |
| 3 | Hakuba, Nagano | +35.2% | International ski resort demand |
| 4 | Chitose, Hokkaido | +34.4% | Mixed retail and residential growth |
| 5 | Hakuba, Nagano | +33.0% | Vacation home purchases |
| 6 | Furano, Hokkaido | +30.0% | Emerging resort area |
| 7 | Shibuya, Tokyo | +29.0% | Shibuya Station redevelopment |
| 8 | Taito (Asakusa), Tokyo | +27.6% | Tourism and foot traffic |
| 9 | Ozu, Kumamoto | +26.0% | TSMC semiconductor factory |
| 10 | Taito (Asakusa), Tokyo | +25.2% | Transit-linked development |
Why Is Chitose, Hokkaido Leading the Country?
Chitose dominated the 2026 survey because of Rapidus, Japan’s national semiconductor project. The government is backing the construction of a next-generation chip factory in the city, and the effects are spreading into surrounding land. Hotels are going up to house workers. Logistics facilities are expanding near New Chitose Airport. Office space is being built to support the growing workforce.
Three different Chitose survey points made the top five, and they were not all the same type of land. One was office-led, one hotel-led, and one mixed retail-residential. This suggests the growth is broad rather than limited to a single street or project.
A similar pattern is appearing in Ozu, Kumamoto, where TSMC (the Taiwanese chipmaker) is building a factory. That location saw a 26% jump in land values.
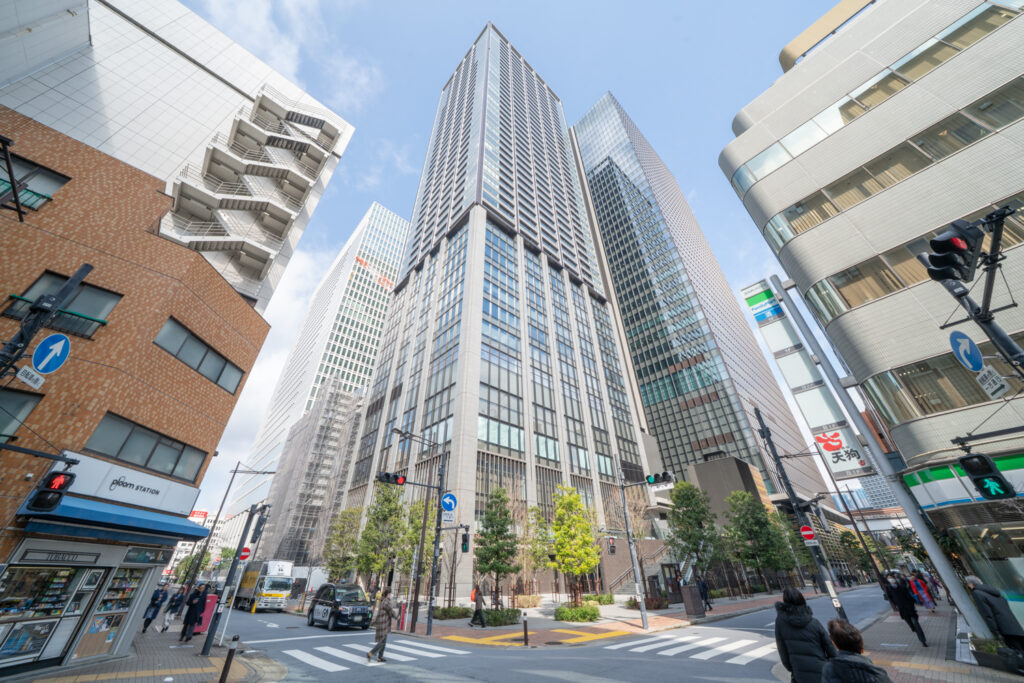
What About Tokyo?
Tokyo averaged an 8.22% increase across its 2,560 benchmark points, making it the strongest-performing prefecture overall. Within the 23 special wards, commercial land prices rose by an average of 13.8%, with 18 of the 23 wards seeing increases above 10%.
The single largest commercial land price increase in Tokyo was in Shibuya’s Sakuragaoka district at 29%, driven by the large-scale Shibuya Station and nearby redevelopments. The Asakusa area in Taito ward placed strongly as well, with six of the top 10 commercial land price increase points in Tokyo located in that district. This reflects the area’s strong tourism foot traffic and ongoing development around transit connections.
For residential land in the 23 wards, prices rose by an average of 9.0%. The highest increase was in Minato ward’s Konan area at 22.2%, followed by Bunkyo ward’s Hongo at 20.8% and Minato ward’s Akasaka at 20.5%. These are all neighborhoods with strong demand for condominiums and have limited supply.
Tokyo also held every spot in the top 10 for both the most expensive commercial and residential land in the country. The single most expensive commercial land point was in Ginza at ¥67,100,000 per square meter (about ¥221 million per tsubo), up 10.9% from the year before. The most expensive residential land point was in Akasaka, Minato ward, at ¥7,110,000 per square meter, marking its ninth consecutive year in first place.
How Did Osaka, Fukuoka, and Other Major Cities Perform?
Osaka saw an overall increase of 4.20%. One notable trend in 2026 was that the Minami area (Namba and Shinsaibashi) overtook the Kita area (Umeda) in growth rate for the first time in six years. This shift is linked to inbound tourism demand and the Osaka Expo.
Fukuoka continues to grow faster than most major cities, with Tenjin recording a 6.6% increase and Hakata at 6.3%. The Tenjin Big Bang redevelopment project and expansion around Hakata Station are helping push land values higher across the city.
Okinawa averaged 6.52% growth, with resort areas like Onna on the west coast growing at 8.8%, outpacing the urban core of Naha at 5.1%.
What About Resort and Ski Areas?

Japan’s resort property markets are attracting attention, but the 2026 data reveals a wide gap between locations. Not every resort town is rising at the same speed.
| Resort Area | Survey Points | Average Price per m² | Average Year-on-Year Change |
|---|---|---|---|
| Hakuba, Nagano | 3 | ¥25,557 | +26.9% |
| Nozawa Onsen, Nagano | 2 | ¥29,350 | +21.7% |
| Kutchan (Niseko area), Hokkaido | 4 | ¥120,750 | +12.3% |
| Karuizawa, Nagano | 11 | ¥113,506 | +9.8% |
| Myoko, Niigata | 9 | ¥19,904 | -0.8% |
These numbers are eye-catching, but the number of survey points matters. Hakuba’s 26.9% average comes from just three benchmark locations. That is a strong signal, but it does not mean every piece of land in Hakuba jumped by a quarter.
Karuizawa’s has 11-point sample which shows a broader market direction. And Myoko’s slight decline is a reminder that the “ski resort” label alone does not guarantee rising values. The location, accessibility, and type of demand matter just as much.
For the Niseko and Kutchan area, the town-wide average of ¥120,750 per square meter at +12.3% sounds moderate compared to the headlines. But the single Hirafu benchmark point, which sits closest to the ski resort core, showed ¥189,000 per square meter at +21.9%. This gap highlights how much location within a resort town can affect prices.
Interested in buying land or property in Hakuba, Visit our sister company Resort Japan Now!
Where Did Land Prices Fall in 2026?
Japan is increasingly a two-speed market. While the strongest areas pull ahead, some prefectures continue to see slight modest declines.
| Prefecture | Average Year-on-Year Change | Weakest Survey Point |
|---|---|---|
| Shimane | -0.46% | Tsuwano: -4.8% |
| Niigata | -0.41% | Niigata Nishi: -4.1% |
| Kagoshima | -0.36% | Minamikyushu: -4.1% |
| Akita | -0.32% | Yokote: -3.8% |
| Aomori | -0.28% | Goshogawara: -3.5% |
These are not dramatic crashes. The declining areas tend to share similar characteristics: people are moving away, public transit is limited, and there is no strong tourism or industrial anchor to support demand.
The gap between rising and declining areas is widening each year. Major cities and areas with clear economic drivers continue to attract people and capital, while smaller towns without those advantages fall further behind.
What Does This Mean for People Buying Property in Tokyo?
For anyone looking at property in central Tokyo, the 2026 land price data confirms what many people already feel: prices are going up, and they have been going up consistently for five years running.
Residential land in Tokyo’s five central wards (Chiyoda, Chuo, Minato, Shinjuku, and Shibuya) rose by an average of 13.0% in 2026. The remaining 18 wards averaged 8.5%. This means central locations are pulling away from outer areas in terms of price growth, though the outer wards are also rising.
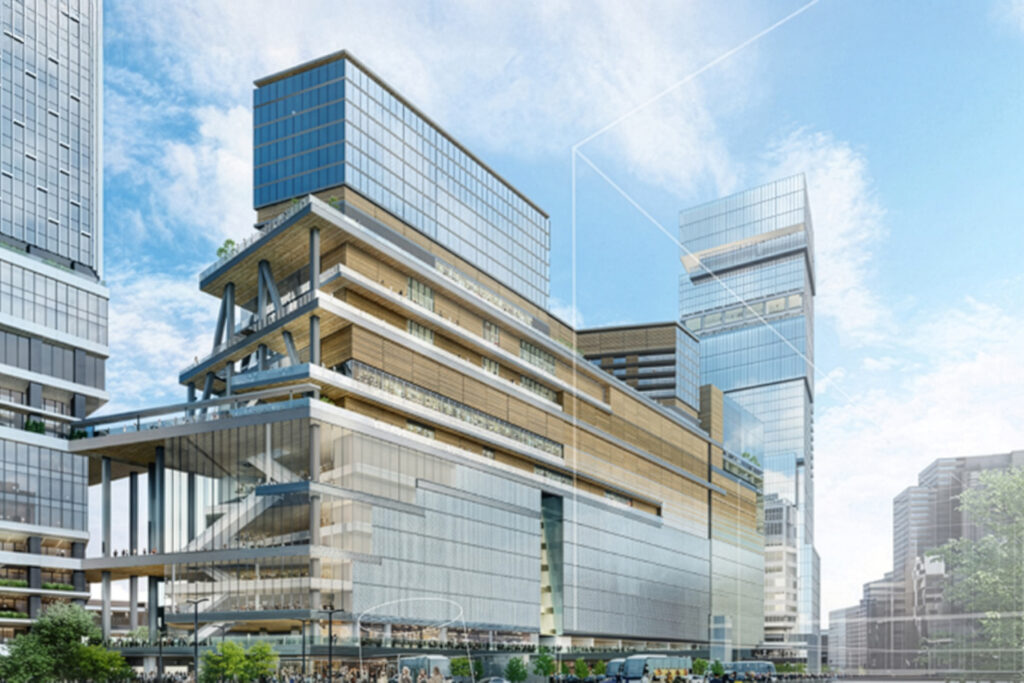
Several factors are keeping Tokyo land values strong. Ongoing redevelopment projects like Shibuya Station and Shibuya Stage, Takanawa Gateway City, Shinjuku Station and The large Tsukiji Redevelopment are creating new commercial and residential space that lifts surrounding property values. Strong demand from both domestic and international buyers continues, especially in the condominium market. And with construction costs rising due to labor shortages and material prices, the cost of building new supply is also climbing.
For sellers, the data suggests that well-located properties in central Tokyo are becoming more valuable each year. For buyers, it means that waiting may not result in lower prices, though rising interest rates from the Bank of Japan could moderate the pace of growth ahead.
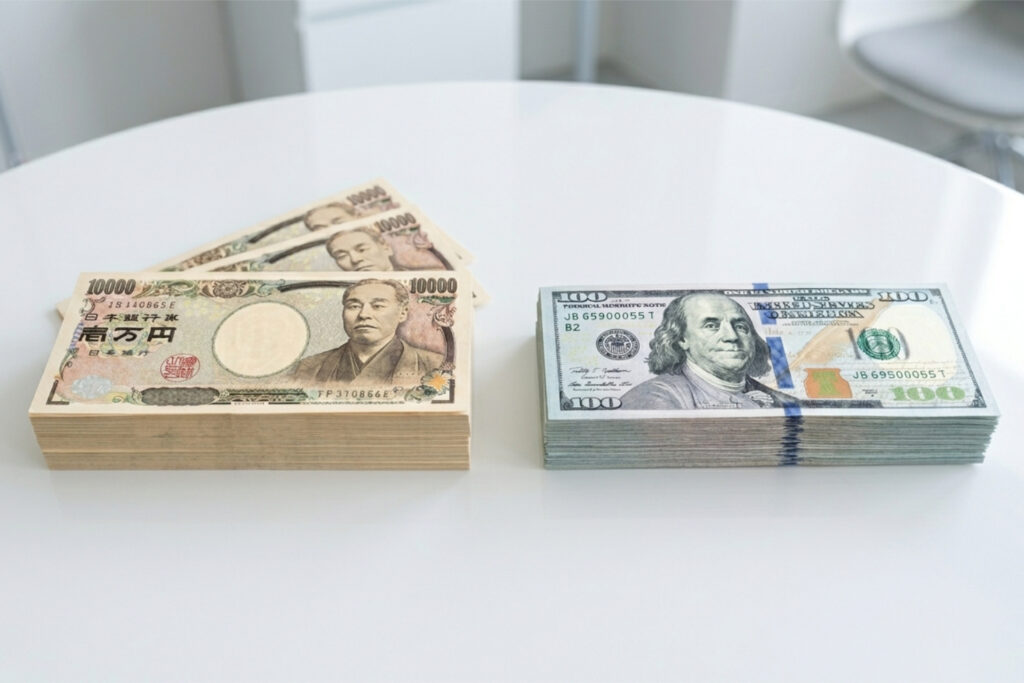
How Does the Weak Yen Affect Property Buyers from Overseas?
The yen has weakened significantly since 2021, when it traded at around ¥110 to the US dollar. In early 2026, the rate sits near ¥150 to ¥160 to the dollar. This means buyers using US dollars, euros, British pounds, or Australian dollars get significantly more purchasing power when converting to yen.
For example, a piece of land valued at ¥189,000 per square meter would have cost a US dollar buyer about $1,718 per square meter in 2021 at the old exchange rate. At today’s rate of approximately ¥150 to the dollar, that same land costs around $1,260 per square meter, which is roughly 27% less in dollar terms even though the yen-denominated price itself has risen.
Japan also places no restrictions on foreign property ownership. There is no foreign buyer tax, no approval process, and no residency requirement. Among developed economies, this combination of open access and currency advantage is unusual.
It is worth noting, however, that currency movements can work in both directions. If the yen strengthens in the future, some of that purchasing power advantage would shrink. Anyone buying property with foreign currency should consider their long-term plans and not rely on exchange rate gains alone.
What Is the Difference Between Official Land Prices and Actual Transaction Prices?
This is an important distinction. The official land price survey tells you the government’s assessed benchmark value for specific survey points. It shows trends and direction. But what buyers actually pay in real transactions can differ, sometimes significantly.
MLIT also publishes actual transaction records from completed sales on a quarterly basis through its Real Estate Transaction Price Information System (不動産取引価格情報). These records show what people really paid, and they can be higher or lower than the official benchmark depending on the specific property and circumstances.
For example, official benchmark values tend to reflect prime or representative sites. Actual transactions in the same broader area might include less desirable parcels, smaller plots, or properties with specific constraints that push prices lower. In resort areas especially, the gap between the benchmark price at a prime location and what most buyers actually pay can be large.
Using both data sources together gives a much clearer picture than relying on either one alone. The official price shows you the trend. The transaction data shows you the reality.
Source: MLIT Real Estate Transaction Price Information System (不動産取引価格情報), available at https://www.reinfolib.mlit.go.jp/
Q&A: Japan Land Prices 2026
What is the official land price survey in Japan?
The official land price survey (公示地価) is published every year by MLIT. It measures land values at around 26,000 benchmark locations across Japan as of January 1. These values serve as a reference for property transactions and public land acquisitions. The survey has been running since 1970.
How much did land prices rise in Japan in 2026?
Land prices across all categories rose by 2.8% nationwide in 2026, based on the MLIT survey released on March 17, 2026. This was the strongest increase since 1992 and marked the fifth consecutive year of rising prices. Residential land rose 2.1% and commercial land rose 4.3%.
Where did land prices in Japan rise the most in 2026?
The largest individual increases were in Chitose, Hokkaido, where one benchmark point rose 44.1% due to semiconductor industry development. Hakuba in Nagano saw increases above 33% linked to international ski resort demand. In Tokyo, the Shibuya Sakuragaoka area rose 29% because of a major redevelopment project joined with the Shibuya Station Redevelopment.
Did any areas see declining land prices in Japan in 2026?
Yes. Several rural prefectures saw modest declines, including Shimane (-0.46%), Niigata (-0.41%), and Kagoshima (-0.36%). These areas tend to have shrinking populations and limited transit access. However, no area saw dramatic price drops.
How much did Tokyo residential land prices increase?
Residential land across all of Tokyo rose by 6.5% in 2026, according to MLIT data. Within the 23 special wards, the average increase was 9.0%. The five central wards (Chiyoda, Chuo, Minato, Shinjuku, and Shibuya) averaged 13.0%.
What is the most expensive land in Japan?
The most expensive commercial land remains in Ginza, Chuo ward, Tokyo, at the Yamano Music Ginza main store site. It was valued at ¥67,100,000 per square meter in the 2026 survey, up 10.9% from the year before. The most expensive residential land is in Akasaka, Minato ward, at ¥7,110,000 per square meter.
Can foreigners buy property in Japan?
Yes. Japan has no restrictions on foreign property ownership. There is no foreign buyer tax, no government approval process, and no requirement to hold residency. Buyers of any nationality can purchase land and buildings in Japan.
What Next?
Whether you are beginning your journey to Japan or already settled in the heart of Tokyo, Housing Japan is here to help. With over 25 years experience we specialize in buying, selling, and managing residential luxury real estate in central Tokyo. From short-term stays to long-term living, we offer options across Tokyo’s most desirable neighborhoods. Our team provides end-to-end service, from finding the right property to managing it after purchase. If you are looking for a home, a second residence, or considering Tokyo real estate as part of your plans, we are ready to help at every step.