New condominium prices in Tokyo’s 23 wards averaged ¥142.49 million in the first half of 2026, up 9.1% year on year. Greater Tokyo passed ¥100 million for the first time in a half-year period. Resale prices per square metre in the 23 wards also rose, while transaction volumes fell across the region.
Key facts at a glance
| Measure | Figure | Year-on-year |
|---|---|---|
| New-build average, 23 wards (H1 2026) | ¥142.49m | +9.1% |
| New-build average, Greater Tokyo (H1 2026) | ¥101.35m | +13.1% |
| New-build supply, Greater Tokyo (H1 2026) | 7,989 units | −0.8% |
| Resale price per sqm, 23 wards (July 2026) | ¥1,357,700 | +2.7% |
| Resale contracts, Greater Tokyo (July 2026) | 3,638 | −8.6% |
| Resale unsold stock, Greater Tokyo (July 2026) | 47,151 units | +5.5% |
Sources: Real Estate Economic Institute, First Half 2026 Greater Tokyo New Condominium Market Trends, 21 July 2026; East Japan Real Estate Information Network (REINS), Monthly Market Watch, July 2026, published 10 August 2026.
What does the latest new-build data show?
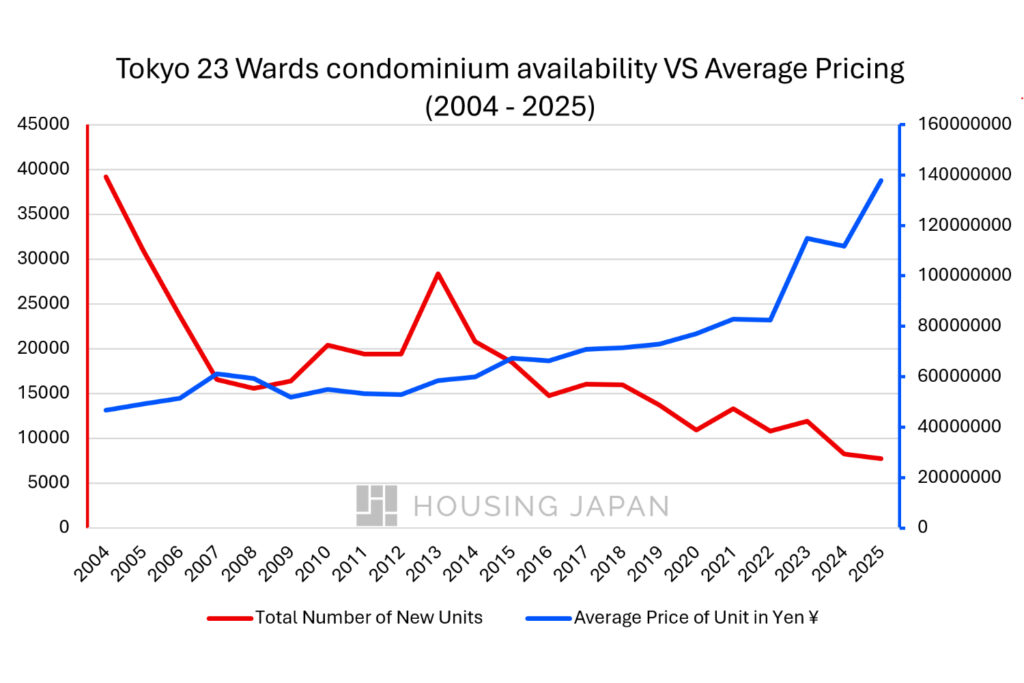
Tokyo’s new condominium market set fresh price records in the first half of 2026 while supply kept shrinking. The Real Estate Economic Institute (REEI) reported on 21 July 2026 that the average new condominium across Greater Tokyo reached ¥101.35 million between January and June, up 13.1%. That is the first time a half-year average has exceeded ¥100 million.
The price per square metre reached ¥1.514 million, up 12.1%. Both figures are half-year highs. Supply came in at 7,989 units, a fall of 0.8% and the fifth consecutive half-year decline. It is also the third year running that half-year supply has stayed below 10,000 units.
How do new-build and resale prices compare by area?
The clearest way to read the market is to set new-build prices against resale prices in the same area, on the same per-square-metre basis. The table below combines REEI’s first-half 2026 new-build figures with REINS resale figures for July 2026.
| Area | Resale ¥/sqm | New-build ¥/sqm | New-build premium | New-build average | New-build supply |
|---|---|---|---|---|---|
| Tokyo 23 wards | ¥1,357,700 | ¥2,226,000 | +64% | ¥142.49m | 2,684 units |
| Kanagawa | ¥589,600 | ¥1,234,000 | +109% | ¥83.46m | 2,132 units |
| Tama / Tokyo outside 23 wards | ¥584,400 | ¥1,118,000 | +91% | ¥75.50m | 1,032 units |
| Saitama | ¥445,300 | ¥985,000 | +121% | ¥64.69m | 839 units |
| Chiba | ¥413,700 | ¥1,246,000 | +201% | ¥89.97m | 1,302 units |
| Greater Tokyo | ¥841,700 | ¥1,514,000 | +80% | ¥101.35m | 7,989 units |
New-build ¥/sqm, average price and supply are REEI, first half of 2026. Resale ¥/sqm is REINS, July 2026. The premium is our own calculation. REEI reports Tokyo outside the 23 wards while REINS reports Tama; the two areas overlap closely but are not identically defined.
The premium is the useful figure here, and it runs opposite to what most people expect. Buyers pay 64% more per square metre for a new build than a resale unit in the 23 wards, the narrowest gap in the region. In Saitama the same premium is 121%, and in Chiba it reaches 201%.
Two things explain that. Central Tokyo resale stock is expensive in its own right, which compresses the gap. In the outer prefectures, new supply is concentrated in a small number of large high-rise schemes in the most popular locations, so the new-build average reflects those projects rather than the wider local market. Chiba is the clearest case: its new-build average rose 56.8% on the year, driven by high-rise launches, while its resale price per square metre was flat at −0.1%. Saitama moved differently again, with new-build prices down 1.3% and supply down 27.0%.
For a buyer choosing between new and existing stock, this is the practical takeaway. The cost of buying new rather than second-hand is lowest in central Tokyo and highest in the commuter belt.
Why is new condominium supply still falling?
Three factors keep new supply constrained: competition for central land, higher construction costs, and rules that slow down building work. Developers struggle to secure suitable sites in central Tokyo, where office, hotel and mixed-use schemes compete for the same plots.
Construction costs have climbed with material prices and a shortage of skilled labour. Rules capping overtime hours for construction workers, introduced in April 2024, have extended the time each project takes to finish. That slows the rate at which finished units reach the market. Our article on Tokyo condominium prices and the new supply shortage sets out the structural background.
One measure of how tight conditions have become is leasehold supply. Developers brought 886 leasehold (定借) units to market in the first half of 2026, against 634 in the same period of 2025. Leasehold lets a developer build without buying the land outright, which controls costs but gives the buyer a fixed-term right rather than full freehold ownership. REEI expects around 14,000 units in the second half of 2026, taking the full year to roughly 22,000.
How are new condominiums selling?
Buyers are taking longer to commit. The Greater Tokyo first-month contract rate was 64.8% in the first half of 2026, down 1.8 percentage points on the year. This is the share of units that find a buyer within the first month of going on sale, so a falling rate means more units sitting available for longer.
The 23 wards recorded 63.9%, down 4.9 points and the steepest fall of any area. Chiba led at 76.7% and Kanagawa reached 66.6%, while Tokyo outside the 23 wards came in at 52.7%. Unsold new-build stock stood at 6,389 units at the end of June 2026, up 363 units on a year earlier.
The pattern is one of buyers with more choice weighing options carefully, rather than a market clearing quickly at any price.
How is the existing condominium market performing?
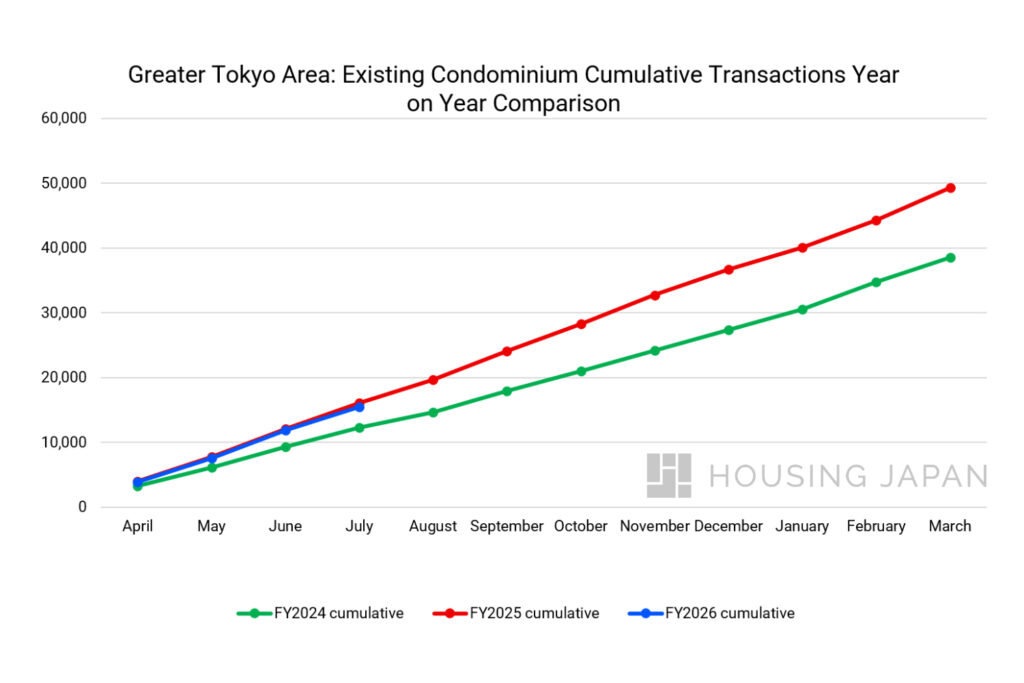
The resale market cooled in July 2026, though prices in the 23 wards held up better than volumes. REINS recorded 3,638 resale condominium contracts across Greater Tokyo, down 8.6% and the fourth consecutive monthly decline. The average contracted price per square metre was ¥841,700, down 1.5% on the year but up 1.9% on the previous month. That level still sits above the October 1990 figure of ¥835,000.
In the 23 wards, prices continued to rise. The average contracted price per square metre reached ¥1,357,700, up 2.7% and the seventy-fifth consecutive monthly increase since May 2020. The average contracted price was ¥77.57 million, up 3.4%, on an average floor area of 56.18 square metres and an average building age of 25.76 years. Volumes told a different story, with 1,509 contracts, down 17.2% and the seventh consecutive monthly fall.
So the central market is not falling. It is thinning. Fewer buyers are transacting, and those who complete still pay more per square metre than a year ago.
July 2026 resale transactions by prefecture
| Prefecture | Transactions | Year-on-year | Price per sqm | Year-on-year |
|---|---|---|---|---|
| Tokyo | 1,863 | −13.9% | ¥1,210,800 | +1.2% |
| of which 23 wards | 1,509 | −17.2% | ¥1,357,700 | +2.7% |
| of which Tama | 354 | +3.8% | ¥584,400 | +10.5% |
| Kanagawa | 911 | −1.1% | ¥589,600 | −1.2% |
| Saitama | 449 | −3.2% | ¥445,300 | +2.3% |
| Chiba | 415 | −3.5% | ¥413,700 | −0.1% |
| Greater Tokyo total | 3,638 | −8.6% | ¥841,700 | −1.5% |
Tama and Saitama posted price gains while Yokohama and Kawasaki fell 2.5%, the first decline there in 13 months. The regional picture is no longer moving in one direction.
Why is the gap between asking prices and sale prices widening?
Sellers are asking substantially more than buyers are paying, and the gap has widened sharply. REINS put newly listed condominiums across Greater Tokyo at ¥1,178,600 per square metre in July 2026, up 20.4% and the twenty-seventh consecutive monthly rise. Unsold stock stood at ¥1,183,000 per square metre, up 28.2%.
Set those against the ¥841,700 per square metre buyers actually paid. Asking prices are running about 40% above achieved prices. In July 2025 the same gap was about 15%, calculated from the equivalent REINS figures.
This means listing portal prices no longer track the market’s clearing level. Sellers have raised expectations faster than buyers have followed, and unsold stock has now risen for five consecutive months to 47,151 units. For anyone valuing a property in central Tokyo, recent achieved prices are the more reliable reference point.
What is driving prices?
Two forces continue to support prices: constrained new supply and overseas demand. A third, cheap borrowing, is now weakening.
Limited new supply pushes buyers who cannot find a new home toward the resale market, which supports prices for existing stock. Overseas demand also remains a factor, helped by a yen that has stayed weak against major currencies. That reduces the cost of Tokyo property in foreign currency terms, even as yen prices climb. Our article on the weak yen and Tokyo real estate covers this in more detail.
One rule change matters for overseas buyers. Since April 2026, non-residents must file a report for all residential property acquisitions in Japan under the Foreign Exchange and Foreign Trade Act. The previous exemption for residential purchases no longer applies. This is a reporting requirement, not a restriction on buying. Anyone can buy Tokyo Property with the same laws as a Japanese Citizen.
How could Bank of Japan rate changes affect the market?
Borrowing costs are at their highest in three decades. The Bank of Japan raised its policy rate to around 1.0% on 16 June 2026, the highest level since 1995, and held it there at its late-July meeting on an eight-to-one vote. The next policy meeting falls on 17 and 18 September 2026.
Higher rates reduce what a given monthly repayment will buy. That pressure falls hardest on domestic buyers using variable-rate mortgages, which fits the sharp fall in transaction volumes alongside broadly steady prices per square metre in the 23 wards. Cash buyers and overseas purchasers, who are less exposed to Japanese mortgage rates, face a different calculation.
Interested to see what you could borrow? See Housing Japan’s Yen Mortgage calculator here.

What does the MLIT index show?
The Ministry of Land, Infrastructure, Transport and Tourism publishes a Real Estate Price Index built from around 300,000 transactions a year. Its most recent published reading covers December 2025 and put the national condominium index at 225.1 against a 2010 average of 100, up 8.4% on the year. The Tokyo Metropolis condominium index stood at 234.8. Against January 2020, when the national index was 151.4, values have risen roughly 49%.
MLIT announced on 29 July 2026 that publication is postponed, citing a fault in the calculation programme that delayed the January to April 2026 releases. Until that is resolved, REINS remains the timeliest official measure of Tokyo transaction prices. Buyers can check individual recorded transactions through MLIT’s free Real Estate Information Library.
What the terms mean
Contracted price (成約価格) is what a buyer actually paid on a completed sale. Newly listed price (新規登録価格) is what a seller is asking on a property that has just come to market. The two differ, and the gap between them is currently wide.
First-month contract rate (初月契約率) is the share of newly released units that sell within their first month. Leasehold (定期借地権, shortened to 定借) gives a fixed-term right to the land rather than outright ownership, usually with a lower purchase price.
What does this mean for buyers and sellers?
For buyers, the practical change is that more stock is available and it is sitting longer. Building quality, management history and location matter more than speed. Asking prices in central Tokyo currently run well above achieved prices, so recent comparable sales are the better guide when assessing a listing. Our guide to Tokyo’s luxury neighbourhoods covers area differences in detail.
For sellers, pricing has become the decisive factor. Well-located and well-managed properties still attract interest, but the widening gap between listings and completed sales shows that ambitious asking prices are not converting. Realistic pricing against recent transactions is what moves a property.
At Housing Japan we focus on buying, selling and managing luxury residential real estate in central Tokyo. Our bilingual team can guide you through the process, from choosing an area to negotiating contracts and working with banks.
Get in touch with Housing Japan below to speak with one of our property specialists about your goals in the Tokyo market.
Common questions
How much does a new condominium cost in Tokyo’s 23 wards in 2026?
The average new condominium in the 23 wards cost ¥142.49 million in the first half of 2026, up 9.1% year on year, at ¥2.226 million per square metre. Central wards including Minato, Chiyoda and Shibuya sit above that average.
Are Tokyo property prices falling in 2026?
Not in the 23 wards. Resale prices per square metre rose 2.7% year on year in July 2026, a run of increases that began in May 2020. Across Greater Tokyo, achieved resale prices per square metre fell 1.5%. Transaction volumes declined in both.
What is the difference between new and existing condominium prices?
New condominiums in the 23 wards averaged ¥142.49 million in the first half of 2026. Existing condominiums across Greater Tokyo averaged ¥52.67 million in July 2026. New-build averages also swing more, because a single large luxury launch can move a monthly figure sharply.
Why do new-build and resale figures tell different stories?
New-build averages reflect whichever projects launched that month, so they are volatile. Resale data covers thousands of transactions across all price bands and moves more gradually, which makes it the better read on wider conditions.
Do foreign buyers need permission to buy property in Japan?
No. There is no restriction on foreign nationals or non-residents buying property in Japan. Since April 2026, non-residents must file a report for residential acquisitions under the Foreign Exchange and Foreign Trade Act, but this is a reporting step rather than an approval.
Where can I check Tokyo transaction prices myself?
REINS publishes its Monthly Market Watch summary around the tenth of each month. MLIT’s Real Estate Information Library allows searches of individual recorded transaction prices. Both are free.