A History of Tokyo Houses and Real-Estate Prices
After a long climb during the decades of Japan’s economic miracle, prices exploded in the late eighties in the frenzy of the bubble economy. Over the following decade values fell back sharply, most steeply for commercial land in the major urban areas, more moderately for residential land, reaching a low point around 2002. Since then, prices have risen, and the market has been in a recovery phase for the past two decades. Greater Tokyo resale condominium prices rose year on year for 72 consecutive months to April 2026, a run that ended in May.
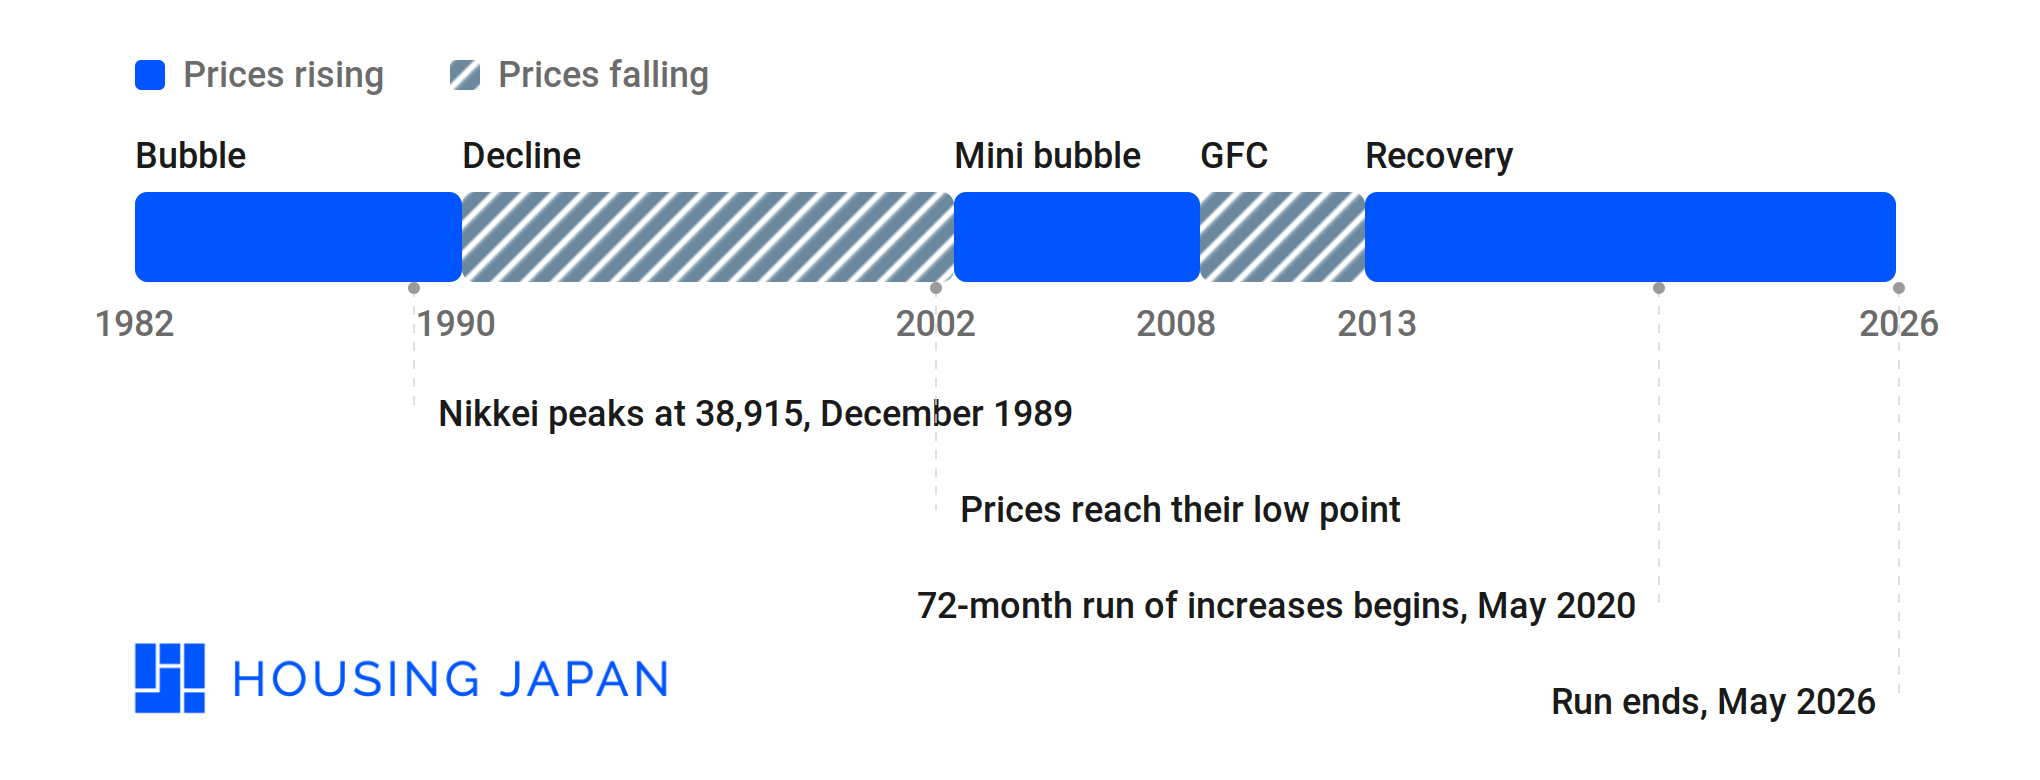
| Period | Direction | What drove it |
|---|---|---|
| 1982–1990 | Rising | Loose monetary policy after the 1985 Plaza Accord; policy rate cut to 2.5% by 1987 |
| 1990–2002 | Falling | Lending restrictions (総量規制), rates raised to 6%, banks left holding bad loans |
| 2002–2008 | Rising | Zero rates, quantitative easing, and the launch of the J-REIT market |
| 2008–2012 | Falling | Global financial crisis; non-recourse lending market closed |
| 2013–2026 | Rising | Monetary easing, limited new supply, and overseas demand; year-on-year increases ended in May 2026 |
Bubble period (1982 to 1990)
Real-estate prices across Japan rose by as much as six to seven times during the 1980s asset bubble. Confidence was strong as the Japanese economic model, often referred to as “Japan Inc.” seemed to be invincible. Japanese corporations, awash with cash, made speculative purchases of real-estate and corporate assets all over the world. At home in Japan, low interest rates and loose monetary policy fuelled a strong economy and high stock prices.
Following the Plaza Accord in 1985, the yen appreciated from around 240 yen to the USD to about 120 yen in less than a year. In response, the Bank of Japan lowered interest rates from 5.5% down to 2.5% in 1987. This dramatic easing of monetary policy at a time of economic strength sparked an explosion of real-estate transactions and high stock prices. Fiscal policy moved in the same direction. The tax reform initiated under Prime Minister Nakasone reduced the national corporate tax rate on retained earnings from 43.3% to 42% in 1987, and cut the top national income tax rate from 70% to 60%, reducing the number of brackets from fifteen to twelve. Further reductions followed under subsequent administrations, taking the corporate rate to 37.5% by fiscal 1990 and the top income tax rate to 50% in 1989.
It was said at the time that the value of the Imperial Palace in Tokyo exceeded the value of all the real-estate in California. Land in Ginza 4-chome was reported at the time to have topped JPY 90,000,000 (around $750,000 at then-current exchange rates) per square metre.
Bubble burst
As asset prices reached extreme levels the government tried to slow the growing bubble and introduced policies which led instead to its bursting.
In 1990 the Ministry of Finance put restrictions on the total volume of real-estate lending (総量規制) which caused an immediate and dramatic drop in the availability of credit. Under the National Land Use Planning Act (国土利用計画法), designated monitoring zones (監視区域) in Tokyo required advance notification of land transactions above 100 square metres. These restrictions brought the price rises to a grinding halt. The Bank of Japan also tightened, raising interest rates to a peak of 6% in 1990.
In December 1989 the Nikkei 225 closed at 38,915, a record that stood until February 2024. In the following nine months it crashed to below 20,000. Financial institutions were swamped with bad loans as asset prices tumbled. Land prices were slower to react but eventually started dropping and continued to slide downwards for the next ten years. By 1995 the Bank of Japan had dramatically reversed its monetary policy, slashing rates to a previously unthinkable 0.50% in a desperate effort to stem the slide of the economy and asset prices.
Mini Bubble (2002 to 2008)
The new millennium began but the Japanese economy and asset prices failed to recover. The Bank of Japan cut rates further to 0.1% and, from March 2001, adopted quantitative easing. Around this time the J-Reit market began and the newly listed investment trusts caused a flurry of activity in the property market. In the early years of the new decade there were trillions of yen worth of securitised real-estate transactions done which led to a mini “fund boom” in real-estate prices. These investment trusts focused their attention on assets in the major cities, prices in some parts of central Tokyo rose as much as 70 to 100% compared to lows seen in 2002 but the overall market continued to languish.
Mini Bubble Bursts
By 2006 it seemed once again that a bubble was beginning so the MOF moved again to restrict investment real-estate loans. The global financial markets then took centre stage as the US sub-prime loan scandal erupted in 2007 culminating in the “Lehman shock” of 2008. Foreign investors disappeared from the Japanese real-estate market as the securitised non-recourse lending market ceased to exist.
Real-estate prices in Tokyo once again slumped but did not return to the lows of 2002. By 2010 prices managed to stabilise at levels around 50% above the lows.
Earthquake
On March 11 2011 the Tohoku region of Japan was devastated by an enormous earthquake, tsunami and the melt-down of the Fukushima nuclear power station. Tokyo also experienced a large tremor but buildings and infrastructure were largely unaffected. Initially the real-estate market froze as buyers were very nervous to commit in the wake of the disaster. As the situation stabilised and the recovery efforts in Tohoku commenced, real-estate transactions resumed and price levels in Tokyo returned to broadly where they had been before the earthquake.
Abenomics and monetary easing (2013 to 2016)
The recovery that began in 2013 was driven by monetary policy rather than by the securitised lending that had powered the mini bubble. In April 2013 the Bank of Japan, under governor Haruhiko Kuroda, introduced quantitative and qualitative easing with a stated target of 2% inflation. The yen weakened from around 80 to the US dollar in late 2012 to roughly 120 by 2015, lowering the effective cost of Japanese property for overseas buyers.
Two further events shaped the period. In September 2013 Tokyo was awarded the 2020 Olympic and Paralympic Games, prompting a programme of infrastructure and redevelopment work across the city. In April 2014 the consumption tax rose from 5% to 8%, bringing purchases forward into the preceding quarter and reducing demand immediately afterwards.
Easing continued as the period progressed. The Bank of Japan applied a negative interest rate to a portion of financial institutions’ reserves from January 2016 and adopted yield curve control that September, and mortgage rates fell accordingly.
Supply tightened over the same years. New condominium sales in Tokyo’s 23 wards totalled 28,340 units in 2013 and declined steadily thereafter. A shortage of construction labour raised building costs from the middle of the decade, and land acquisition costs followed.
The Olympic build-up (2016 to 2020)
By the second half of the decade, price increases reflected constrained supply and rising costs more than speculative activity. Land values followed the same pattern. In the prefectural land price survey (基準地価), commercial land nationwide returned to growth in 2016. In 2018 the all-use national average rose for the first time in 27 years, by 0.1%, while residential land nationwide remained slightly negative at −0.3%. Across the three major metropolitan areas the same survey recorded commercial land up 4.2% and residential land up 0.7%.
Inbound tourism grew throughout the period, from just over 10 million overseas visitors in 2013 to approximately 31.9 million in 2019, supporting demand for hotel and retail development in central Tokyo and in regional destinations.
In October 2019 the consumption tax rose again, from 8% to 10%, having been postponed twice from its original date of October 2015. The following March the Olympic Games were postponed as the COVID-19 pandemic spread, and land values fell 0.6% nationwide in the 2020 prefectural survey, the first decline in three years.
The residential market turned upward within months. From May 2020, resale condominium prices in Greater Tokyo began a run of year-on-year monthly increases that would continue for six years.
Current Market Position
How high have Tokyo property prices risen?
The highest residential land value in Japan is recorded in Minato-ku. In the 2026 official land price survey, a benchmark point at 1-14-11 Akasaka was assessed at ¥7,110,000 per square metre, an increase of 20.5% on the previous year and the highest residential land price point in the country for the ninth consecutive year.
At the top of the market, a penthouse at Azabudai Hills in Minato-ku was reported to have sold for approximately ¥20 billion, the highest figure reported for an apartment in Japan.
What do official land prices show?
The Ministry of Land, Infrastructure, Transport and Tourism published its 2026 land price survey (地価公示) on 17 March 2026, measuring values as of 1 January. Nationwide, land prices rose 2.8% across all uses, the fifth consecutive annual increase and the largest since 1992. Commercial land rose 4.3% and residential land 2.1%. In Tokyo, all-use prices rose 8.4%, with commercial land up 12.2% and residential up 6.5%.
When did the recent run of price increases end?
Average resale condominium prices per square metre in Greater Tokyo rose year on year for 72 consecutive months, from May 2020 to April 2026, according to the Real Estate Information Network for East Japan (REINS). The run ended in May 2026, the first decline in six years. In June 2026 the average price per square metre was 0.8% lower than a year earlier, with transaction volumes down 1.3% and inventory rising for a fourth consecutive month.
Have Tokyo property prices recovered to bubble levels?
Resale condominium prices in Greater Tokyo briefly passed their bubble-era level in early 2026. The average sold price reached ¥856,100 per square metre in February 2026, above the September 1990 figure of ¥855,000. By June 2026 it had eased to ¥826,400, slightly below that 1990 level.
Land is measured differently, and the two are often confused. The 2.8% national increase recorded in the 2026 survey was the largest annual rise since 1992, but that describes the rate of change rather than the level.
What Next?
At Housing Japan we specialise in buying, selling, renting and managing residential property in central Tokyo. The company was established in October 2000 and operates as a licensed brokerage under Tokyo Governor Licence No. (3) 98912, with a bilingual team working with Japan-based residents, overseas buyers and corporate clients.
If you are researching the market rather than transacting, our other Resources cover the purchase process, financing and the costs involved in a sale.
For questions about a specific property, a valuation, or the steps involved in buying or selling in Tokyo, contact us and we will direct your enquiry to the relevant member of the team.
Related Resources



Properties for Sale