MLIT’s Tokyo condominium price index stood at 234.8 in December 2025, more than double its 2010 level, and the median pre-owned condominium in Minato-ku sold for ¥1,960,000 per sqm in 2025, up 78.8% from 2016. Rents add income on top of that growth, and the exchange rate sets the cost for overseas buyers.
Key facts
- MLIT’s Real Estate Price Index for Tokyo condominiums stood at 234.8 in December 2025 (2010 average = 100; seasonally adjusted, preliminary), against 225.1 for Japan as a whole.
- The median pre-owned condominium in Minato-ku sold for ¥1,960,000 per sqm in 2025, up 78.8% from 2016 (Housing Japan analysis of MLIT transaction data).
- Rents for private non-wooden homes in Tokyo rose 9.3% between 2018 and 2023 in the Housing and Land Survey, the latest official ward-level reading; the next survey is planned for 2028 (Tokyo Metropolitan Government summary).
- Residential land prices in the 23 wards rose 9.0% in the year to 1 January 2026, led by Minato-ku at 16.6% (2026 Land Price Publication, Tokyo Metropolitan Government).
- A property priced at ¥100 million cost a dollar buyer about US$640,000 at the September 2026 average rate of ¥156.23, about US$36,000 less than a year earlier (Bank of Japan; Housing Japan calculation).
What are the sources of return on Tokyo property?
Returns on Tokyo property come from the rent a tenant pays and from any change in the property’s value between purchase and sale. Rent follows local tenant demand, such as the number of households forming and the number of people working in the central wards, so it tends to change slowly.
Property values move with the cost and availability of borrowing, the amount of money looking for property and, for overseas buyers, the exchange rate. That means a property’s value can rise or fall for reasons that have nothing to do with the tenant living in it.
Total return is income return plus capital growth, usually measured over one year. A hypothetical 6% return made up mostly of rent depends on keeping the unit let. A 6% return made up mostly of price movement depends on the market at the point of sale.
Gross yield is a year’s rent divided by the purchase price. Net yield first deducts running costs such as management fees, repair reserve contributions (shūzen tsumitate-kin, 修繕積立金) and fixed asset tax (kotei shisan-zei, 固定資産税). The official statistics in this article track rents and prices separately, so they show which way each part has moved. For owners who let a Tokyo property, see Housing Japan’s comprehensive, multilingual property management service.
How have Tokyo property prices moved since 2010?
MLIT’s Real Estate Price Index (不動産価格指数, fudōsan kakaku shisū) for Tokyo condominiums stood at 234.8 in December 2025, where the 2010 average equals 100. This means condominium transaction prices in Tokyo were about 2.3 times their 2010 level.
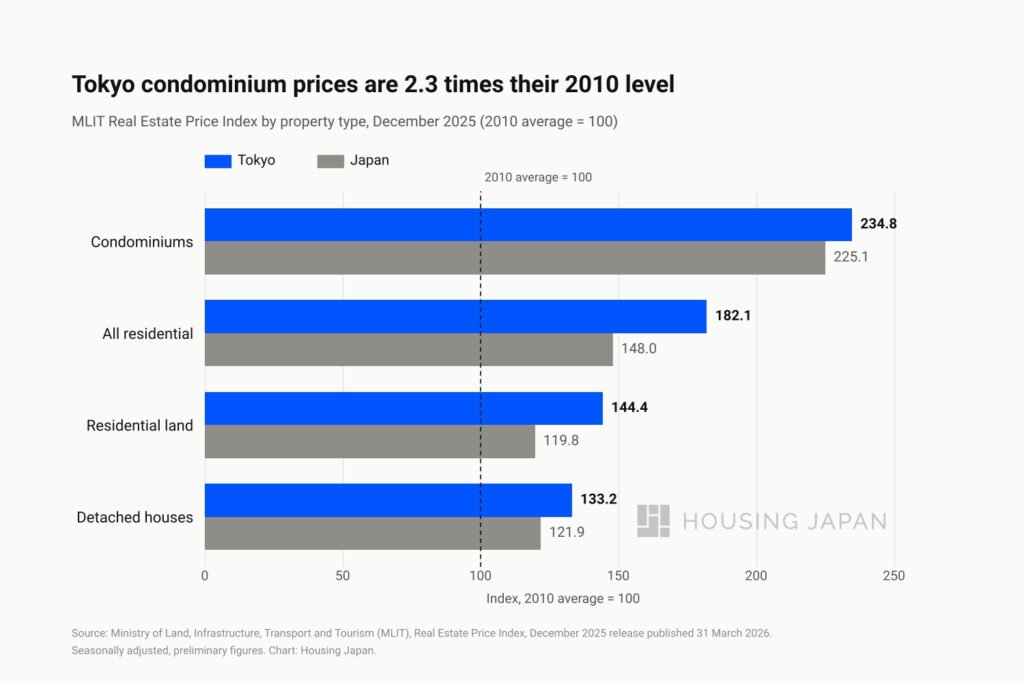
The Ministry of Land, Infrastructure, Transport and Tourism (MLIT, 国土交通省) builds the index from about 300,000 transaction price records a year. It publishes the index monthly for residential property and quarterly for commercial property. The December 2025 figures are seasonally adjusted and preliminary, and MLIT revises preliminary figures for three months after first publication.
| Property type | Tokyo (東京都) | Japan |
|---|---|---|
| All residential | 182.1 | 148.0 |
| Residential land | 144.4 | 119.8 |
| Detached houses | 133.2 | 121.9 |
| Condominiums | 234.8 | 225.1 |
MLIT Real Estate Price Index, December 2025, seasonally adjusted, preliminary. 2010 average = 100. Published 31 March 2026.
Tokyo’s all-residential index of 182.1 compares with 148.0 for Japan as a whole, so prices in the capital have risen faster than the national average since 2010. Within Tokyo, the condominium index is 101.6 points higher than the index for detached houses.
How have condominium prices moved in Minato-ku and central Tokyo?
The median sale price of a pre-owned condominium in Minato-ku rose from ¥1,096,000 per sqm in 2016 to ¥1,960,000 in 2025, an increase of 78.8%, according to Housing Japan’s analysis of MLIT transaction data. Minato-ku’s median rose in every year of the period, and by more than in the other four central wards analysed.
Across Chiyoda-ku, Chūō-ku, Minato-ku, Shibuya-ku and Shinjuku-ku combined, the median rose 60.0%, from ¥1,000,000 to ¥1,600,000 per sqm. Prefecture-wide figures also cover the outer wards and the Tama area, so these five wards are a closer guide to central Tokyo.

| Ward | 2016 (¥ per sqm) | 2025 (¥ per sqm) | Change |
|---|---|---|---|
| Minato-ku | 1,096,000 | 1,960,000 | +78.8% |
| Chūō-ku | 1,000,000 | 1,647,000 | +64.7% |
| Shibuya-ku | 1,000,000 | 1,600,000 | +60.0% |
| Chiyoda-ku | 1,050,000 | 1,650,000 | +57.1% |
| Shinjuku-ku | 909,000 | 1,400,000 | +54.0% |
| Five wards combined | 1,000,000 | 1,600,000 | +60.0% |
Median sale price per sqm of private floor area, pre-owned condominiums, by year of sale. Housing Japan analysis of MLIT Real Estate Information Library, Real Estate Transaction Price Information, downloaded 9 October 2026.
The figures come from MLIT’s Real Estate Information Library (不動産情報ライブラリ, Fudōsan Jōhō Raiburari), which publishes the prices buyers report to the ministry. Housing Japan calculated the median price per sqm of private floor area for each ward and year from 31,603 sales between 2016 and 2025, with 226 to 916 sales per ward each year.
A median moves with the mix of apartments sold each year, unlike a quality-adjusted index such as MLIT’s Real Estate Price Index. The mix changed little over the period: the median apartment sold measured 35 sqm in 2016 and 40 sqm in 2025, and its building dated from 2003 in the first year and 2004 in the last. The dataset publishes prices and floor areas in rounded form.
The library’s contract price data, a separate series that starts in 2021, also shows Minato-ku’s median rising, from ¥1,232,000 per sqm that year to ¥1,882,000 in 2025.
How have Tokyo rents moved?
Rents for private non-wooden rental homes in Tokyo rose 9.3% between 2018 and 2023, to ¥4,053 a month per sqm of living-room area, according to the Housing and Land Survey (住宅・土地統計調査, Jūtaku Tochi Tōkei Chōsa) as summarised by the Tokyo Metropolitan Government (Housing Japan calculation). Non-wooden homes are mostly apartments in reinforced concrete and steel-frame buildings.
The Statistics Bureau runs the Housing and Land Survey every five years. Its latest figures describe rents as of 1 October 2023 and were published in September 2024, and the next survey is planned for 2028, so official figures will not show recent rent movements in central Tokyo for several years.
The survey reports rent per jō (畳), the area of one tatami mat. Under the Statistics Bureau’s definitions, rooms without tatami count as two jō per 3.3 sqm, so one jō equals 1.65 sqm. Housing Japan used that factor to convert the survey’s figures to sqm.
| Survey year | Private non-wooden, per sqm | All rented homes, per sqm |
|---|---|---|
| 2018 | ¥3,707 | ¥3,108 |
| 2023 | ¥4,053 | ¥3,450 |
| Change | +9.3% | +11.0% |
Average monthly rent, Tokyo, as of 1 October of each survey year. Housing and Land Survey, Tokyo Metropolitan Government summaries; Housing Japan conversion from rent per jō at 1 jō = 1.65 sqm.
Floor area in the survey covers living rooms, bedrooms and dining rooms, and leaves out kitchens, bathrooms, toilets, entrances and corridors, so rent per sqm of an apartments’s total floor area is lower than the table shows. The survey’s rent also excludes management fees, deposits and key money.
Over the longer survey record, rents for private non-wooden homes fell 6.7% between 2008 and 2013 and were almost unchanged in 2018, before rising again by 2023 (Housing Japan calculation). The survey records rent paid in existing tenancies, so the averages also move with the mix of homes being let.
The consumer price index (CPI) gives a monthly reading, but only for the 23 wards as a whole and only for existing leases. Its private rent component (民営家賃, min’ei yachin) rose 2.2% in the year to September 2026, according to the mid-month preliminary estimate published by the Statistics Bureau of Japan (総務省統計局) on 2 October 2026.
Asking rents, which landlords advertise for vacant units, set the income on a new purchase or a re-let, and they can move faster than the official series when demand rises.
Does rental income or price change drive returns in Tokyo?
MLIT’s Tokyo condominium index more than doubled between 2010 and December 2025, reaching 234.8, while average rents for private non-wooden homes in Tokyo were 2.2% higher in 2023 than in 2008. For owners who bought in this period, the value of the property has grown much faster than the rent it earns.
When prices rise faster than rents, the gross yield on a new purchase falls and more of the total return comes from the property’s value at the point of sale.
Residential land in the 23 wards rose 9.0% in the year to 1 January 2026 in MLIT’s Land Price Publication (地価公示, chika kōji), up from 7.9% a year earlier, according to the Tokyo Metropolitan Government.
Land prices, MLIT’s transaction index and the rent surveys measure different things over different periods, so they show direction rather than a precise split of returns for any one property.
How do condominiums, houses and wards compare?
Tokyo condominiums are 9.7 points above the national condominium index, while Tokyo houses and land are 11.3 and 24.6 points above theirs (MLIT, December 2025). Condominium prices have risen strongly across Japan, and Tokyo condominiums have moved much further since 2010 than Tokyo houses or land.
Minato-ku recorded the largest rise in residential land prices among the 23 wards in the 2026 Land Price Publication, at 16.6%. Taitō-ku (14.2%) and Shinagawa-ku (13.9%) followed, while the smallest rises were in Katsushika-ku (5.6%), Edogawa-ku (5.7%) and Nerima-ku (6.2%).

| Ward | Change to 1 Jan 2026 | Change to 1 Jan 2025 |
|---|---|---|
| Minato-ku | +16.6% | +12.7% |
| Taitō-ku | +14.2% | +10.2% |
| Shinagawa-ku | +13.9% | +11.9% |
| 23-ward average | +9.0% | +7.9% |
| Nerima-ku | +6.2% | +5.3% |
| Edogawa-ku | +5.7% | +5.1% |
| Katsushika-ku | +5.6% | +5.4% |
Average change in residential land prices. 2026 Land Price Publication, Tokyo Metropolitan Government press release, March 2026.
Every ward in the table rose faster in 2026 than in 2025. For transport, schools and neighbourhood detail in for neighbhoods in Tokyo, see Housing Japan’s Area guides.
How does the yen affect Tokyo returns for foreign investors?
The yen averaged ¥156.23 per US dollar in September 2026, compared with ¥147.93 in September 2025, according to the Bank of Japan (日本銀行, Nippon Ginkō). For the same yen price, that made Tokyo property 5.3% cheaper in dollars over the year: an apartment priced at ¥100 million cost about US$640,000 at the September 2026 average, against about US$676,000 a year earlier (Housing Japan calculation based on Bank of Japan data). It was at its weakest in July 2026, averaging ¥162.45.
| Month | Yen per US dollar |
|---|---|
| December 2015 | 121.78 |
| December 2020 | 103.83 |
| December 2024 | 153.72 |
| December 2025 | 155.85 |
| September 2026 | 156.23 |
Bank of Japan, Tokyo market, USD/JPY spot at 17:00, monthly average.
For an overseas owner, currency is a separate part of total return, alongside rent and price change. The return in dollars is the yen return adjusted for the change in the exchange rate between purchase and sale, so a yen that strengthens while the property is held adds to it, and a yen that weakens takes away from it.
How does Tokyo’s economy compare with Japan’s?
Tokyo produced ¥125 trillion of nominal output in fiscal 2023, 21.0% of Japan’s total, according to the Tokyo Metropolitan Government’s prefectural accounts (都民経済計算, Tomin Keizai Keisan) published on 26 March 2026. Real growth, which strips out inflation, was 0.5%.
Japan’s nominal GDP rose from ¥533.7 trillion in fiscal 2014 to ¥642.4 trillion in fiscal 2024, an increase of 20.4%. Real GDP rose 5.9% over the same decade, from ¥554.4 trillion to ¥586.9 trillion, according to the Cabinet Office’s annual national accounts (2020 benchmark), released on 23 December 2025.
Average monthly cash earnings rose 2.3% to ¥355,941 in 2025, according to the Ministry of Health, Labour and Welfare’s Monthly Labour Survey (毎月勤労統計調査, Maitsuki Kinrō Tōkei Chōsa) for workplaces with five or more employees. Rents, wages and prices are all paid in current yen, so nominal growth in output and pay is the backdrop to what tenants can spend on housing.
What should investors watch?
MLIT publishes its Real Estate Price Index monthly with about a three-month lag, and the Land Price Publication each March, valued as of 1 January. Rents are tracked monthly by the CPI for Tokyo’s 23 wards and every five years by the Housing and Land Survey. The Bank of Japan publishes yen/dollar rates daily and as monthly averages, and incomes come from MHLW’s Monthly Labour Survey, published monthly, and the Cabinet Office’s quarterly GDP figures.
MLIT’s last published index runs to December 2025. Releases due since April 2026 have been delayed by a fault in its calculation program, and no new date had been set as of 10 October 2026, so check the MLIT index page before quoting a 2026 figure.
How can Housing Japan help with investing in or letting Tokyo property?
Housing Japan K.K. has been a licensed real estate brokerage in Tokyo since 2000 (Tokyo Governor (3) No. 98912) and is registered as a Financial Instruments Business Operator (Kanto Local Finance Bureau (Kinsho) No. 3522). Its services cover buying, selling, investing, renting and property management in Tokyo.
Buyers considering Tokyo property as an investment can talk to Housing Japan’s investment team about specific properties, wards and building types, including Minato-ku and the other central wards covered in this article. The figures here describe the market as a whole, while each building has its own rent history and running costs.
Owners who already hold a Tokyo property can use Housing Japan’s property management service to find tenants and manage the property once it is let.
To discuss buying, letting or managing a property, use the contact form below. The Housing Japan newsletter features properties for sale, property collections and some exclusive listings, and occasionally includes new Newsroom articles.
Frequently asked questions
How much have condominium prices risen in Minato-ku?
The median sale price of a pre-owned condominium in Minato-ku rose from ¥1,096,000 per sqm in 2016 to ¥1,960,000 in 2025, an increase of 78.8%, based on Housing Japan’s analysis of MLIT transaction data. Across five central wards (Chiyoda, Chūō, Minato, Shibuya and Shinjuku), the median rose 60.0% over the same period.
Which Tokyo wards saw the largest land price rises in 2026?
Minato-ku recorded the largest rise in residential land prices among the 23 wards in the 2026 Land Price Publication, at 16.6% in the year to 1 January 2026. Taitō-ku (14.2%) and Shinagawa-ku (13.9%) followed, while Katsushika-ku had the smallest rise at 5.6%, against a 23-ward average of 9.0%.
Are Tokyo property returns mostly from rent or from price growth?
Since 2010, price growth has outpaced rent by a wide margin. MLIT’s Tokyo condominium index reached 234.8 in December 2025 (2010 average = 100), and the median pre-owned condominium in Minato-ku rose 78.8% between 2016 and 2025, while average rents for private non-wooden homes in Tokyo were 2.2% higher in 2023 than in 2008.
How much have rents in Tokyo risen?
Private rents in Tokyo’s 23 wards rose 2.2% in the year to September 2026 in the Statistics Bureau’s consumer price index. Rents for private non-wooden homes in Tokyo rose 9.3% between 2018 and 2023 in the Housing and Land Survey, reaching ¥4,053 a month per sqm of living-room area.
How does the yen affect overseas buyers of Tokyo property?
A weaker yen lowers the dollar cost of buying: a property priced at ¥100 million cost about US$640,000 at the September 2026 average rate, about US$36,000 less than a year earlier. After purchase, a stronger yen adds to an overseas owner’s return in their home currency, and a weaker yen reduces it. (The yen averaged ¥147.93 per US dollar in September 2025 and ¥156.23 in September 2026, according to the Bank of Japan)
Is the MLIT Real Estate Price Index up to date?
MLIT has not released new index figures since 31 March 2026, when it published residential prices to December 2025. Every release due from April 2026 was held back because of a fault in its calculation program, and on 28 September 2026 MLIT postponed the June 2026 figures as well. No new date had been announced as of 10 October 2026.
Which indicators should investors track for Tokyo property?
Track prices through MLIT’s Real Estate Price Index and annual Land Price Publication, rents through the CPI for Tokyo’s 23 wards, currency through Bank of Japan exchange rates, and incomes through MHLW wage data and Cabinet Office GDP. Each series answers a different question, so read them side by side rather than as one measure.
If you want tailored advice speak to a professional from Housing Japan’s Investment team.
About the authors

Maximilian Jacob is Research and Content Lead at Housing Japan K.K., a licensed real estate brokerage in Tokyo (Tokyo Governor (3) No. 98912) that has advised international buyers, sellers and tenants in central Tokyo since 2000. He researches the Tokyo prime residential market using primary Japanese sources, including Ministry of Land, Infrastructure, Transport and Tourism (MLIT) transaction and land price data, National Tax Agency (NTA) roadside land valuations, Bank of Japan policy statements and e-Stat national statistics. His work focuses on foreign buyer procedure, property taxation, non-resident financing, and the Minato, Shibuya and Chiyoda luxury markets.

Yudai Yamaguchi is Head of Sales and Head of Property Management at Housing Japan K.K. He has more than a decade of real estate experience across Japan and the United States, spanning development, sales operations, investment, acquisitions, leasing, construction and property management. He previously held management roles at the Open House Group in both countries, including General Manager of its Atlanta office, where he oversaw local real estate operations. He holds a bachelor’s degree in Liberal Arts from Waseda University and studied International Relations at the University of Washington.
Sources
MLIT – Real Estate Price Index (不動産価格指数)
Statistics Bureau – Consumer Price Index, Tokyo ward area
Tokyo Metropolitan Government – Statistics (Housing and Land Survey, prefectural accounts)
Bank of Japan – Exchange rates, Tokyo interbank market (monthly)
Cabinet Office – National Accounts of Japan